
Share of Shelf: How to Measure, Track, and Calculate It in 2026
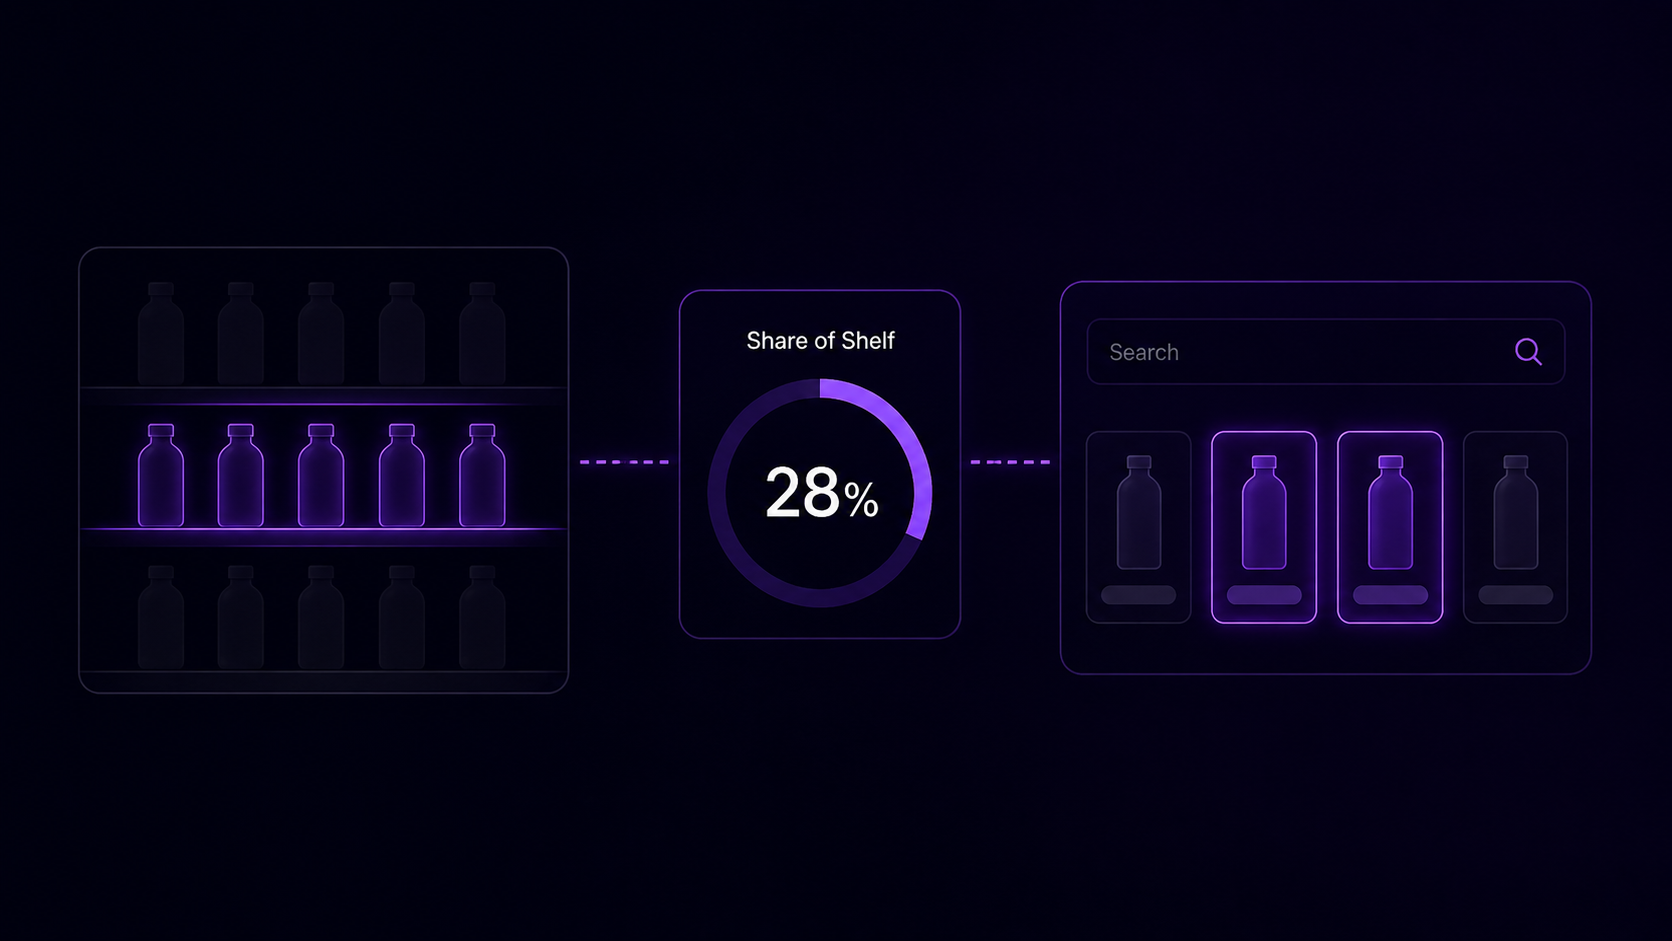
Shelf space is finite. Whether it is the linear centimetres of a pasta aisle in a supermarket or the first page of search results on Amazon, only a few brands get to be seen first. Share of shelf is the number that tells a category, pricing, or digital shelf team how much of that visible space belongs to them right now, across stores, retailers, and marketplaces.
For brands selling through third-party retailers, this number quietly decides a lot. It shapes shopper visibility, conversion rates, retailer negotiations, and how much promotional activity translates into actual sales. Yet many teams still measure it manually, on a quarterly cycle, with samples too small to spot the losses that matter.
This guide breaks down what share of shelf means in 2026, how to calculate it for both physical and digital shelves, what to track alongside it, and how to keep the number trustworthy when you are monitoring hundreds of SKUs across dozens of retailers.
What Is Share of Shelf?
Share of shelf (SoS) is the percentage of available shelf space within a defined category that a specific brand or product occupies. The category context can be as wide as "beverages" or as narrow as "organic oat milk in 1L cartons." Within that frame, share of shelf measures how prominent a brand is at the point where a shopper actually decides what to buy.
In physical retail, that prominence is measured in facings, linear centimetres, or eye-level positioning. In ecommerce, it usually shifts into search-result visibility: how many of the first 20 or 50 listings for a given keyword belong to a brand, including organic and sponsored placements.
Both versions answer the same question for the team running the category. If a shopper walks into the aisle or searches for the keyword today, how much of what they see is mine?
Physical Share of Shelf vs Digital Share of Shelf
The two share the same logic. The data sources, refresh rate, and operational implications are quite different. Most enterprise brands now monitor both, because shoppers move between channels and research online before buying offline.
Physical share of shelf tells you how often shoppers see your product in the aisle. Digital share of shelf tells you how often they see it on the screen. Together they describe a brand's actual presence at the moment of decision, which is what makes the metric useful in the first place.
How to Calculate Share of Shelf
The formula is the same regardless of channel. The inputs differ.
Variants worth knowing
Most mature teams calculate share of shelf in more than one way, because each variant tells a slightly different story.
- Facings-based SoS counts every visible front-facing unit. Useful for execution and planogram audits.
- Linear share of shelf measures the actual width of shelf space occupied. Better for brands with wider or unusual packaging.
- Eye-level share weights facings by vertical position, since shelves at adult eye level convert much better than the top or bottom rows.
- Share of search counts ranked listings on a search results page, often within the top 20 or 50 positions.
- Share of category looks at how many of all category listings on a retailer site belong to a brand, regardless of search queries.
A brand with compact packaging may show a high facings-based SoS while occupying a small amount of linear space. That gap is one reason category teams cross-check facings against linear space when they are preparing for retailer negotiations.
Why Share of Shelf Matters in 2026
Three pressures have made the metric more commercially relevant than it was a few years ago.
Private label expansion. Retailer-owned brands have continued to absorb shelf space across grocery, beauty, and household categories, particularly in Europe and North America. When private label takes a row, branded competitors lose visibility and bargaining power at the same time.
Search-first shopping behaviour. A growing share of category research now happens on retailer websites, marketplaces, and AI shopping assistants before a shopper ever walks into a store. Digital shelf position influences in-store basket decisions long before the trip starts.
Always-on category dynamics. Pricing, promotions, content, and stock change daily on the digital shelf. A brand that monitors share of shelf monthly is essentially reading a snapshot of a market that has already moved. Several recent industry guides now recommend daily monitoring of share of search and weekly cadence for content and availability.
The brands that take share of shelf seriously tend to use it as a forward-looking indicator. A decline in share of shelf usually shows up before the corresponding decline in sales, which gives commercial teams a window to react.
Key Metrics That Sit Alongside Share of Shelf
Share of shelf on its own can be misleading. A brand can hold a high share of shelf and still lose conversion if its products are out of stock, its content is outdated, or its pricing is uncompetitive. These are the metrics that give it context.
When teams report share of shelf without these supporting metrics, the number can flatter or mislead. A 25% share that sits on out-of-stock listings is worth less than a 15% share on fully available, well-rated products.
Common Challenges Brands Face When Tracking Share of Shelf
The metric is simple. Getting it right at scale is where the work sits.
Inconsistent category definitions
Different retailers organise the same products under different category trees. A protein bar might sit in "Snacks" on one site, "Health and Wellness" on another, and "Sports Nutrition" on a third. Without a consistent product matching layer, share of shelf comparisons across retailers become meaningless.
Sample size problems
Many manual share of shelf audits rely on a small set of stores visited quarterly, or a handful of keyword searches checked once a week. Categories that move daily need monitoring cadence to match, otherwise the data tells you about a state the market has already left.
Schema drift on retailer sites
Retailer websites change layout, attribute names, and pagination logic regularly. A web scraper built to capture listings six months ago may now silently miss sponsored placements, mobile-specific results, or new tile formats. This is one of the more common reasons reported share of shelf numbers drift from reality without anyone noticing.
Mixing organic and paid placements
Some teams report digital share of shelf using only organic listings. Others include sponsored placements. Both are defensible. Mixing them inside the same report without flagging which is which makes the metric impossible to interpret consistently.
Single retailer fixation
A brand may track Amazon closely and ignore Walmart, Target, Carrefour, MercadoLibre, or fast-growing marketplaces in its core regions. Category share shifts often appear on smaller retailers before they show up on the largest ones, where competition is heaviest.
How to Measure Share of Shelf at Scale
For enterprise brands tracking share of shelf across multiple retailers, regions, and categories, the work breaks into three layers.
1. Reliable data collection
For physical retail, this means consistent store audits, ideally with image recognition or RFID-supported feeds, refreshed on a cadence that matches the category. For digital retail, it means scheduled extraction of search results, category pages, and product detail pages across every relevant retailer. The data has to capture facings or listings, position, sponsored status, price, stock, and product attributes in the same shape every time.
2. Product matching and normalisation
The same product sold under different SKUs, titles, or pack sizes across retailers needs to be matched accurately. Without this step, share calculations end up double-counting variants or missing them entirely. For categories with high variant counts, like apparel, beauty, or beverages, matching quality determines whether the share of shelf number can be trusted.
3. Alerting and review rhythm
Share of shelf should feed into a regular operating cadence. Many enterprise brands now run share of search and competitive activity reviews weekly, content and availability reviews on a continuous basis, and a monthly category review that compares share of shelf with sales, price, and assortment data. Alerts are reserved for changes that warrant action: a ranking drop on a hero SKU, a competitor surge on a high-traffic keyword, or a sudden availability gap on a key retailer.
This kind of system replaces the quarterly snapshot model that most teams started with, and it works because the data is fresh enough to act on while the corrective window is still open.
How Import.io Aperture Supports Share of Shelf Tracking
For brands monitoring digital share of shelf across multiple retailers and marketplaces, Import.io Aperture provides the underlying data layer. Aperture extracts structured product, ranking, content, availability, and pricing data from retailer websites on a scheduled basis, with monitoring and validation built in so the inputs to your share of shelf calculations stay reliable as retailer pages change.
For category and digital shelf teams specifically, that means share of search and share of category numbers can be calculated from the same data feed that supports pricing intelligence, digital shelf analytics, and competitive monitoring. The benefit of a managed approach here is fewer broken pipelines, consistent data shape across retailers, and a single source of truth when the numbers go into a planning meeting.
For physical retail, share of shelf data continues to come from store audits, image recognition systems, and field execution platforms. The digital layer described here complements rather than replaces that work.
Conclusion
Share of shelf has moved from a quarterly audit metric into a near-continuous indicator of brand presence across both physical and digital retail. The calculation is straightforward. Keeping the inputs accurate, consistent, and current across dozens of retailers is the harder discipline, and the one that decides whether the number is genuinely useful in planning meetings.
Brands that treat share of shelf as a live operational metric, with proper supporting data on availability, content, price, and ranking, tend to identify category shifts earlier, defend visibility more effectively in retailer negotiations, and convert promotional activity into actual sales more consistently than those that rely on snapshots.
The format of the shelf will keep changing. AI shopping surfaces, autonomous purchase agents, and retail media networks all add new places where share of shelf needs to be measured. The underlying question stays the same: when a shopper is choosing, how much of what they see is yours?
Share of shelf is one signal. The full guide shows how to connect it with pricing, availability, promotions, and market movement.
