
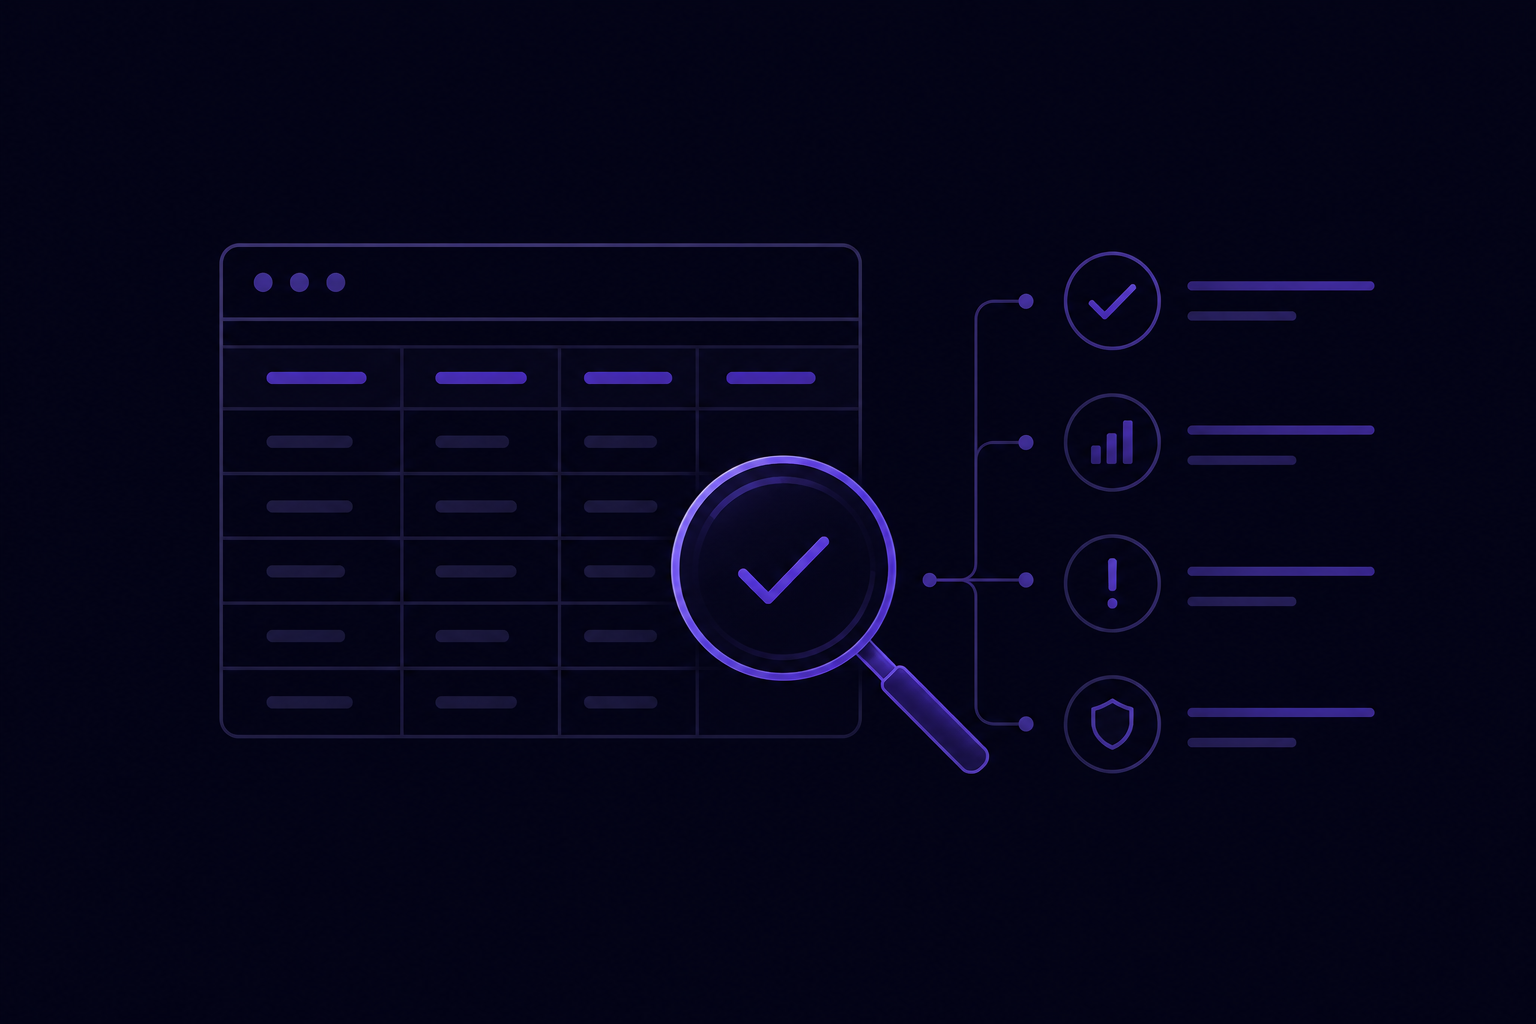
How to test the quality of web data
Originally published in 2015. Updated in June 2026.
Web data has become one of the most important inputs in enterprise decision-making. Pricing teams use it to react to competitor moves within hours. Category managers rely on it to spot assortment shifts. Insights teams build market narratives on top of it. And increasingly, AI systems are trained, fine-tuned, and grounded with it.
All of that only works when the data is accurate. According to Gartner, poor data quality costs the average organization around $12.9 million each year. A 2025 IBM Institute for Business Value study found that 43% of chief operations officers now identify data quality as their most significant data priority, and over a quarter of organizations report losing more than $5 million annually from bad data, with 7% losing $25 million or more. Precisely's 2026 research adds another layer to this picture: 64% of organizations call data quality their top integrity challenge, and 77% rate their own data quality as average or worse.
The risk has grown sharper with the spread of AI. Bad data fed into automated pipelines does not get cleaned along the way. It gets multiplied. VentureBeat reported that 87% of AI projects fail to reach production, with unresolved data quality issues among the most common reasons. So the discipline of testing web data quality has moved from a back-office concern to a board-level one.
This guide walks through the core data quality tests every team working with web data should run, plus the newer checks that have become essential as data pipelines feed analytics, dashboards, and AI workflows.
Start with the source
Before getting into tests, one fact has to be acknowledged. Web data is only ever as good as the source page it came from. A web data extraction platform like Import.io can collect what is on the page. It cannot decide whether the merchant listed the right price, whether the product description matches the SKU, or whether the retailer updated availability on time.
This means web data will always carry some noise. The goal of quality testing is not to remove every imperfect cell. It is to understand where the noise sits, how large it is, and whether the dataset is still fit for the decision being made. For most enterprise use cases (pricing actions, assortment reviews, competitive monitoring) a well-controlled error margin is acceptable. For AI training and grounding, the bar is usually higher because errors compound through the model.
Once that framing is in place, the actual tests become more useful.
Manual spot checks
Even with strong automation, human review of a small sample is still the fastest way to catch obvious extraction problems.
Pull 10 to 20 random rows from the dataset and open the source page next to each one. Verify that the values in your spreadsheet match what is on the page. Pay particular attention to:
- Prices, especially where promotional and base prices appear on the same page
- Currency and unit fields
- Product titles where the page splits them across multiple elements
- Availability status, since some retailers display it through icons or color rather than text
- Image URLs and any field that looked clean but was filled by a default
This step takes 30 minutes and catches roughly 80% of extraction issues. Whoever runs the check should be someone other than the person who built the extractor. A second set of eyes is usually what surfaces the problem the builder stopped seeing.
Coverage testing
Coverage measures whether the dataset has the right number of records. To run this test, you need an expected count.
For some sources, the expected count is published. Retailers list category totals, marketplaces show paginated counts, brand directories often state how many SKUs they carry. For others, you have to estimate based on previous runs, third-party data, or simple sampling.
The calculation is straightforward:
Coverage % = (actual deduplicated record count) / (expected record count) × 100
A coverage rate above 95% is usually acceptable for monitoring use cases. For datasets feeding AI training or financial reporting, teams often raise the threshold to 98% or higher.
Where coverage drops below the threshold, the usual causes are pagination issues, regional differences in what the source shows, login or geo-blocked content, and infinite-scroll pages that stopped loading. Each of these is fixable. They just have to be detected first.
Completeness testing
Coverage tells you how many rows you have. Completeness tells you whether those rows actually contain the data you expected.
Define which fields should always be present, which fields should sometimes be present, and which fields should rarely be present. The pattern varies by use case:
- Pricing data: price and currency should always be present; promotional price might be present on 20% of rows; review count is optional
- Product catalog data: title, category, and image URL should always be present; reviews and ratings depend on the source
- Digital shelf data: availability, seller, and price should always be present; assortment depth fields vary
Run a completeness check on each field. Look for any column where the null rate has moved significantly from the historical baseline. A sudden jump from 2% nulls to 18% on a critical field is a strong signal that something changed on the source.
Watch out for the trickier kind of null. Fields can look populated but contain placeholder values like N/A, dash, "TBD", "0.00", or a default unit string. A frequency distribution on each field surfaces these quickly. If a column has 200 unique values and one of them appears in 30% of rows, it is worth a closer look.
Data type and validation testing
Each column should have a defined type and a set of validation rules. Type checking catches the basic problems. Validation rules catch the subtle ones.
Common validation patterns:
- Prices match a numeric format with at most two decimal places and an expected currency range
- Dates match an ISO-style format and fall within a plausible window
- Product IDs match the source's known SKU pattern (length, alphanumeric structure)
- URLs resolve to valid paths
- Ratings sit within the expected range, usually 0 to 5 or 0 to 10
- Stock quantities are integers and non-negative
When a field fails validation, the row should be flagged rather than dropped. Dropped rows hide problems. Flagged rows make them visible.
Schema drift detection
This is the test the original 2015 version of this article did not need to include. Today it is one of the most important.
Schema drift happens when a source website changes its HTML structure, renames a field, or shifts where information appears on the page. Without drift detection, an extractor keeps running but starts collecting partial or wrong data. The pipeline looks healthy. The data is not.
A drift detection layer should track:
- Whether expected fields are still present in the response
- Whether new fields have appeared that might carry the data previously in another location
- Whether field positions on the page have moved
- Whether response sizes have changed significantly from the historical baseline
- Whether extraction time has spiked, which often precedes a structural change
When drift is detected, the right response is to alert the team, hold the affected batch, and either retrain the extractor or fall back to a previous schema. Self-healing pipelines that adapt to common changes (the kind built into Import.io's managed services) reduce how often this manual step is needed, but the detection layer matters either way.
Freshness and timeliness testing
A dataset can be accurate, complete, and well-typed, and still be useless if it is two weeks old.
Freshness testing checks how recently each record was collected and whether the collection cadence matches the business need. Pricing data used for daily competitive response needs freshness measured in hours. Assortment data used for quarterly category reviews can tolerate weekly refreshes.
Define a freshness target per use case and monitor against it. Useful checks include:
- Median age of records in the dataset
- Percentage of records refreshed within the target window
- Any record older than the maximum acceptable age, which should trigger a recollection
- Gaps in the collection history that suggest a missed run
Freshness is often the metric business stakeholders care about most, even when they describe the problem as "the data feels off". An assortment shift that happened on Monday is invisible if the data was collected the previous Friday.
Anomaly and outlier detection
Modern web data quality programs increasingly run statistical anomaly detection on top of the basic tests above. The principle is straightforward: if a value or pattern sits well outside the historical norm, flag it for review rather than passing it downstream.
Common anomaly checks:
- A price that moved by more than 30% in a single collection cycle
- A SKU that disappeared from a category page where it has been present for months
- A review count that dropped, which is mathematically unusual and usually points to an extraction error rather than a real change
- A spike in the number of products with identical titles or images, which often signals a parsing issue
- A sudden change in the distribution of values within a categorical field
These checks separate genuine market events from collection errors. Both deserve attention, but for different reasons. A real 40% price drop from a competitor is a commercial signal worth acting on. A 40% price drop caused by an extractor pulling the wrong field is a pipeline issue that needs fixing before any decision is made on the data.
Cross-source consistency
Most enterprise use cases pull data from multiple sources: retailers, marketplaces, brand sites, third-party platforms. Quality testing has to look across these sources as well as within each one.
The standard checks here:
- The same product on two retailers should match through your product matching layer with the expected confidence
- Brand and category labels should be consistent across sources, or have a documented mapping
- Currency conversions should produce comparable prices for the same SKU sold in multiple regions
- Aggregate metrics (average price, total assortment count, share of shelf) should reconcile when calculated through different routes
Product matching is the area where most cross-source quality issues hide. Two SKUs that look identical to a human can have different identifiers, slightly different titles, and inconsistent attribute fields across retailers. A matching layer with documented confidence scores, plus an audit sample reviewed by humans, keeps this dimension under control. This is one of the core challenges covered in web scraping for digital shelf analytics.
AI-readiness checks
For teams using web data to train models, fine-tune retrieval systems, or ground LLM responses, a new category of quality testing has emerged.
AI-readiness checks include:
- Provenance: every record carries a clear source URL, collection timestamp, and extraction confidence score
- De-duplication at the semantic level, not just exact-match level, because near-duplicate records skew model training
- Bias and representativeness review, especially for datasets used in pricing models or recommendation systems
- PII detection and removal for any data that will be used in generative model inputs
- Format consistency, since downstream systems often fail on mixed encodings, inconsistent delimiters, or escaped characters left in the data
- Drift monitoring on the data distribution itself, not just on the source pages, because the model behavior depends on whether the training and inference data come from the same distribution
The cost of skipping these checks is high. Models trained on noisy web data inherit that noise as confident-sounding errors at inference time. Hallucinations and biased outputs frequently trace back to data quality decisions made months earlier.
Building the tests into an ongoing process
Running these tests once at the end of a project is the bare minimum. Running them as a continuous process is what separates dependable data operations from constant firefighting. Ataccama research has found that data teams spend around 50% of their time on remediation work, most of which is preventable with earlier detection.
Each stage should have a clear owner, a defined threshold, and a documented response for what happens when the threshold is breached. The cheapest data quality problem is the one caught before it reaches a dashboard or a model.
When to consider managed delivery
For teams running web data at scale (hundreds of sources, millions of records, multiple downstream systems) the operational load of all these checks becomes significant. Schema changes happen weekly. Anti-bot systems evolve. New sources get added. New AI use cases create new quality requirements.
This is where managed delivery models become worth evaluating. Instead of building and maintaining the full quality stack in-house, the testing, monitoring, and remediation work is handled by a partner whose entire operation is built around delivering process-ready data. Import.io's managed services and Aperture pricing intelligence platform are built on this model: customers receive validated, governed data feeds with quality checks already in place.
The right choice depends on internal capacity, the cost of data downtime, and how central web data is to the business. Teams running a small number of sources for internal projects often manage well in-house. Teams whose pricing, assortment, or AI decisions depend on daily web data usually find managed delivery more efficient once the operational cost of maintaining quality is fully counted.
Make quality a first-class part of the workflow
Web data quality has moved from a technical concern to a commercial one. Pricing decisions, assortment decisions, and AI model behavior all depend on it. The good news is that the tests required to keep quality high are well understood. Coverage, completeness, validation, drift detection, freshness, anomaly detection, cross-source consistency, and AI-readiness together cover most of what goes wrong with web data.
The teams that get this right share a few habits. They run quality tests continuously, not just at project kickoff. They treat schema drift as expected, not exceptional. They keep humans in the loop for sampling and review. And they design their pipelines to flag problems early, where fixing them is cheapest.
If you want to see how Import.io approaches web data quality at enterprise scale, including the validation, monitoring, and governance layers built into our delivery model, get in touch with our team.
