
Tips for organizing your Import.io data and creating reports in Google Sheets
Originally posted on November 14th, 2017. Updated on 11th December, 2025
In this post, we’ll cover some best practices to organize your data spreadsheets for integration with Google Sheets and automate some of your analysis and reporting.
Structuring your data
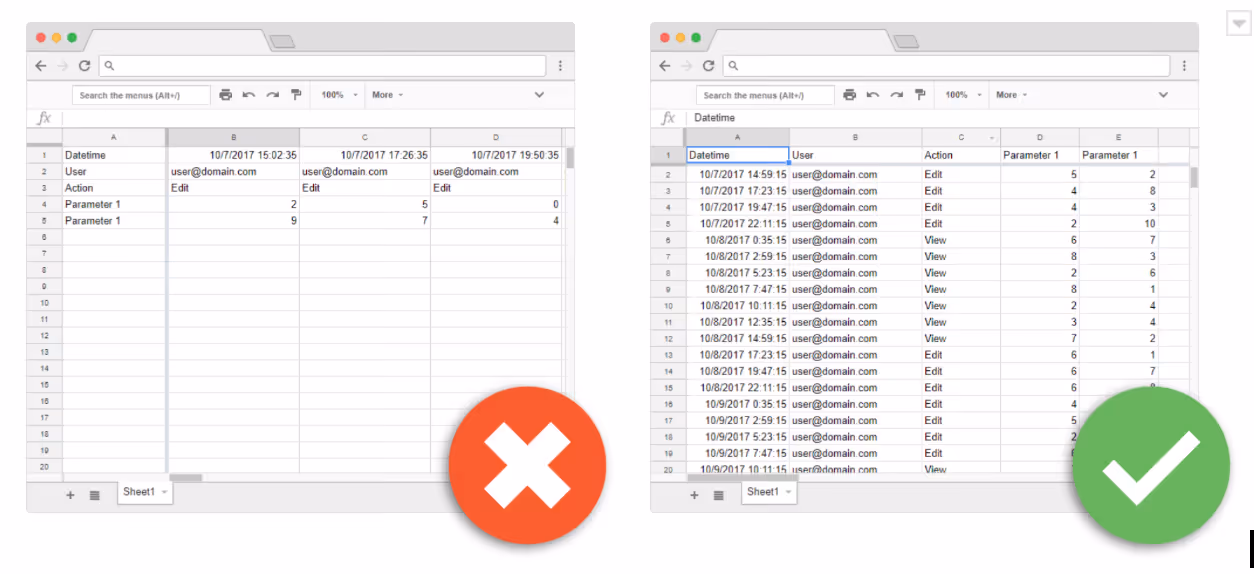
Once you have the Excel spreadsheets, then you need to ensure that the data in your spreadsheets is laid out in a database format.
An ideal database layout in a spreadsheet will have data labels in the first row and the data arranged vertically below. If the data is date dependent its then the date should be in the first column. This structure is ideal to be able to extract data with QUERIES in the future and apply LOOKUP formulas and filters. Also with Google Sheets you are limited by the number of columns, not rows which is another reason why we recommend stacking the data vertically and not horizontally.
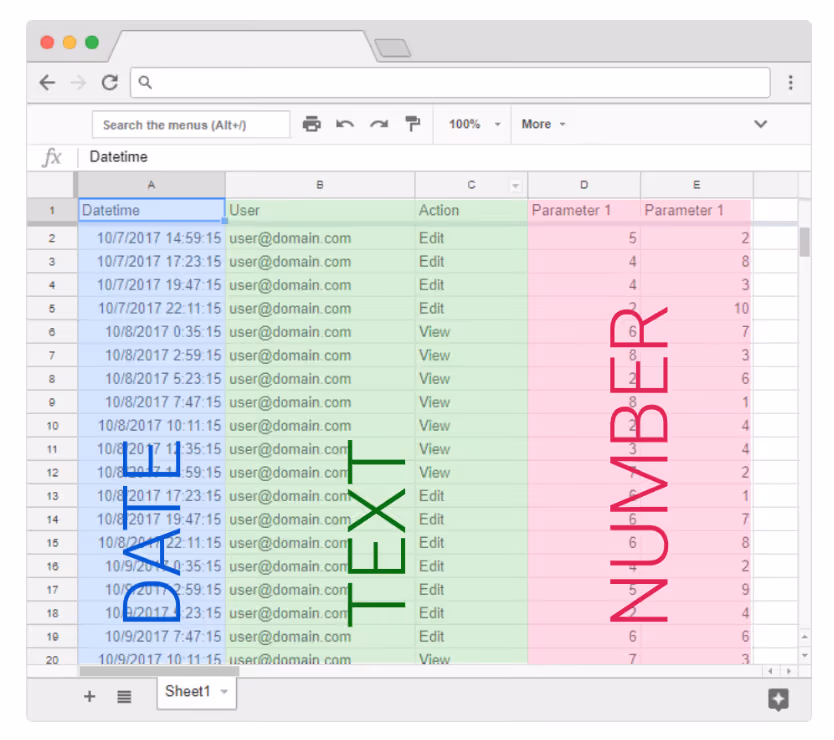
You should apply the same number formatting to entire column ranges (e.g., all data in column A is date format, in column B currency, and so on). To accomplish this set the format via the menu instead of letting Google guessing it for you and applying automatic formats.
One thing to be aware of if you have a team working in different time zones Google Sheets might change the timestamp when transferring data from one sheet to the other. We recommend that you set all spreadsheets to the same time zone by selecting ‘File -> Spreadsheet settings…’
Automating the data transfer
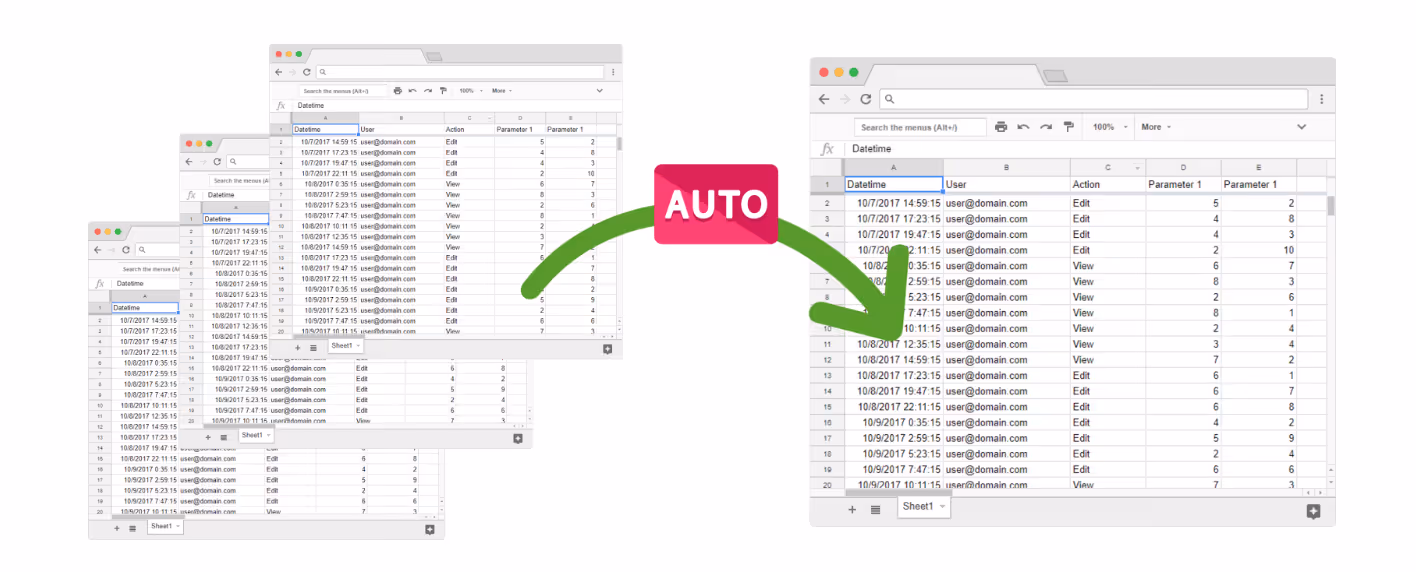
Secondly, to compile information for analysis and reporting you’ll likely have to combine data from multiple spreadsheets. Depending on the company size it can have millions of spreadsheets. People frequently use copy and paste transfer information between spreadsheets, however this practice can be dangerous and introduce errors in the data while wasting a lot of time.
There are two good options to connect your data with Google Sheets to facilitate this process.
- The native =IMPORTRANGE() formula is a good tool to work with small volumes of data and to import select ranges of data. Its limitation arises when you need to develop a sequential or time based routine to transfer data between multiple spreadsheets and you lose traceability or experience ‘Loading…’ errors.
- Sheetgo is a Google Sheet add-on that is designed as a robust way to connect spreadsheets and guarantee traceability and automation of data transfers.
Infinite and automatic formulas
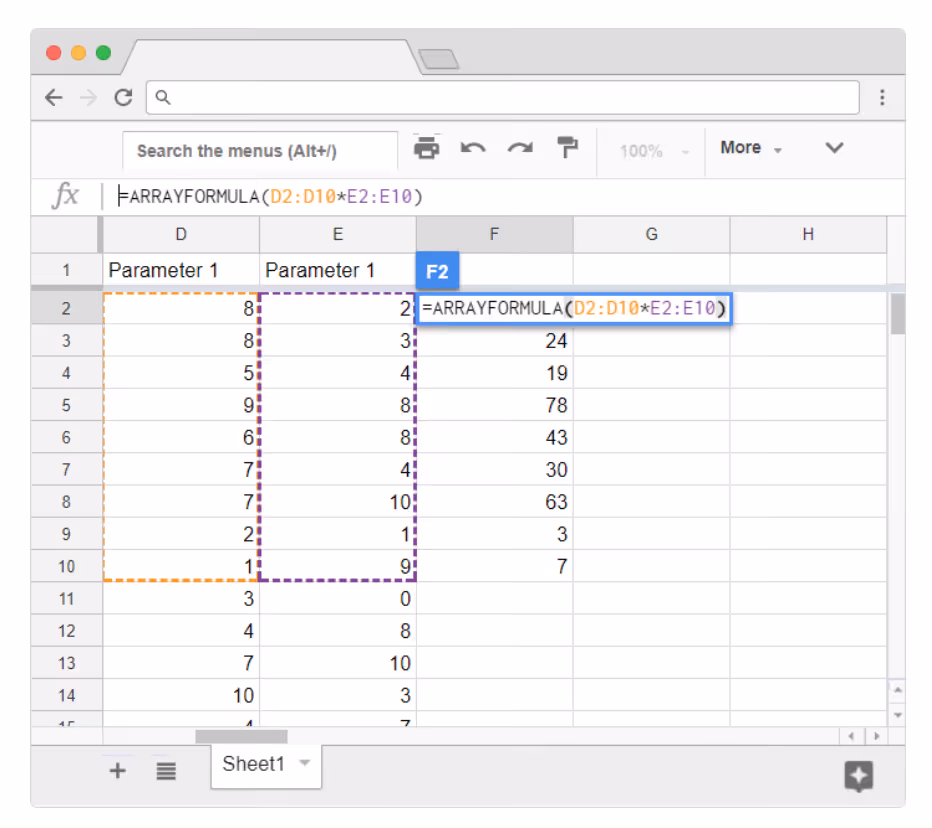
Finally, Google Sheets also allows you to use formulas that consider future insertions of rows and columns so that you don’t have to copy and paste a single formula hundreds of times. The =ARRAYFORMULA() formula automatically replicates the desired formula to an entire array.
When this formula is applied to an infinite range (e.g., =ARRAYFORMULA(A1:A)), it will apply your formula to the last row, independent of blank rows. This can cause some errors (e.g., if you are trying to divide by a blank cell). This can easily be solved with an IF statement to check if that row has data to calculate, and if not display a blank (e.g., if you want to divide all the values in column B by all the values in column A you would type in C1 =ARRAYFORMULA(IF(A1:A=””,””,B1:B/A1:A))
Setting up your spreadsheet to analyze before you have data
As an illustrative example if you want to analyze “How many donuts did we sell last month” and you need that information updated every month on the first for reporting, you can accomplish that by applying infinite ranges and rolling time periods as we show below:
Infinite ranges
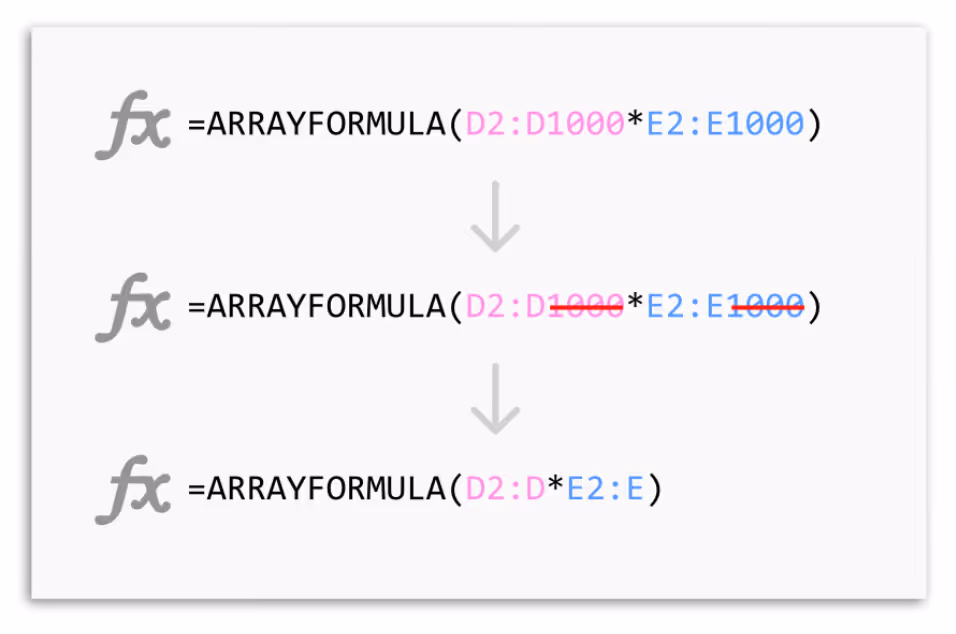
If, for example the data set has 1,000 rows, when you perform your first pass analysis you will likely insert the range A1:A1000 into your formulas. But if you are receiving new data every day on subsequent rows you need to update the range. To avoid having to carry out manual formula maintenance, just remove the number of the end of the range in your ARRAYFORMULA (A1:A) instead of A1:A1000.
Rolling periods of time
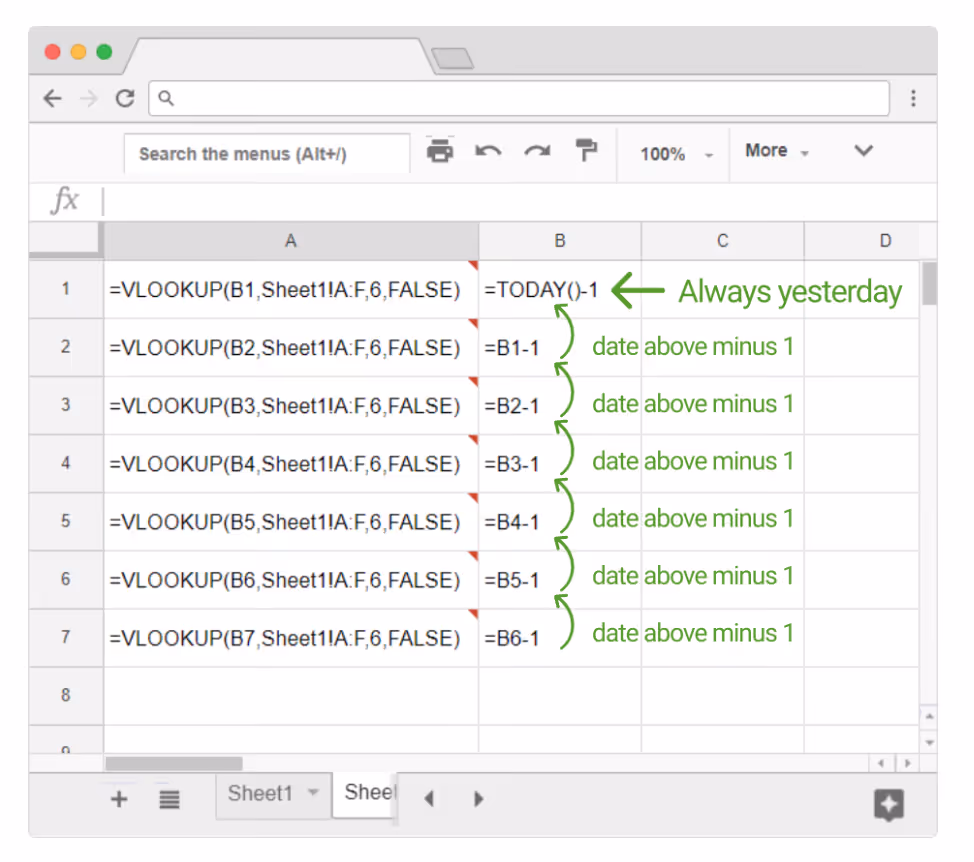
Continuing with our example of the monthly donut sales report, let’s assume that you need a rolling analysis of the last 30 days. You can append new dates every day in column A and insert a formula to sum sales in the second B. But, as time passes, you’ll accumulate too much data and will need to come back to the spreadsheet to adjust the range or adjust the dates. To remove this step, insert a dynamic date as base, and use a formula to make the other dates relative to this base. For example, in the cell A2 use the formula =TODAY()-31 (which will output the date 31 days ago) and in cell A3 use the formula =A2+1(which will output the date of 29 days ago. Copy this formula all the way to A30 and A30 will represent yesterday so you’ll have a range of dates from 31 days ago to yesterday. Now your data range will change automatically, every day, and your dashboard will always display the last 30 days of donut sales.
2025 Update: Modern Best Practices for Data Automation and Analysis
Since this article was first written, the landscape for spreadsheet automation and web data workflows has evolved significantly. As teams ingest larger datasets, automate reporting, and integrate AI tools, the fundamentals covered above remain important, but new best practices have emerged for 2025.
Here’s what’s new:
1. AI-Assisted Data Cleaning and Transformation
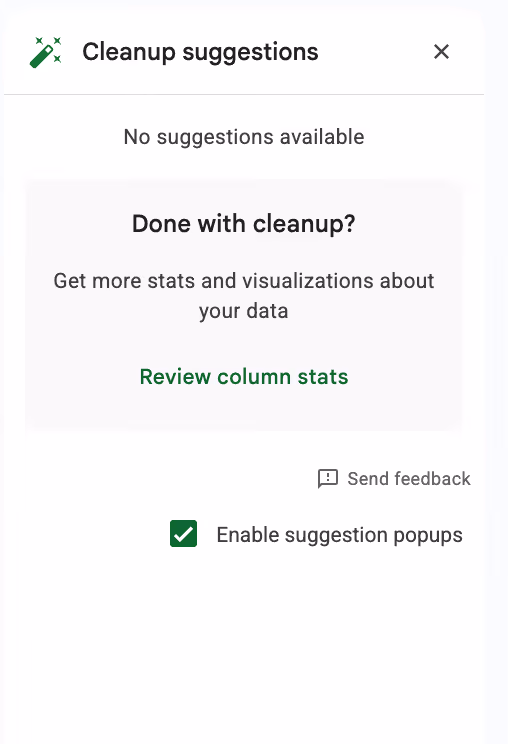
Tools like Google Sheets’ enhanced Smart Cleanup, and Import.io’s new intelligent extraction features, now automatically:
- detect column types
- normalize inconsistent formats
- flag anomalies
- identify duplicate or contradictory data
This reduces manual cleanup and makes your data more reliable before it enters your analysis pipeline.
2. Web Data Pipelines Are Now Continuous, Not Batch-Based
Instead of exporting spreadsheets daily, many teams now use continuous web data pipelines:
- Import.io can push structured data directly into Google Sheets or BigQuery
- Sheetgo and other workflow tools can run scheduled, multi-step automations
- Dashboards update in near real-time
This means analysts spend far less time transferring files and more time interpreting results.
3. Governance, Lineage, and Auditability Matter More Than Ever
In the era of AI regulation and compliance:
- Your datasets need to be traceable
- You need to know where each field came from
- Transformations must be logged and reproducible
Using consistent sheet structures (the original article’s advice) is now essential for downstream governance.
Import.io and similar platforms now support automated lineage tracking so teams can trust their entire data lifecycle.
4. Google Sheets Has Lifted Formula Limits With Advanced Functions
Since 2023–2025, Sheets introduced powerful functions that reduce complexity:
LET()→ cleaner formulasLAMBDA()→ reusable custom logicQUERY()improvementsXLOOKUP()→ replaces older lookup functions
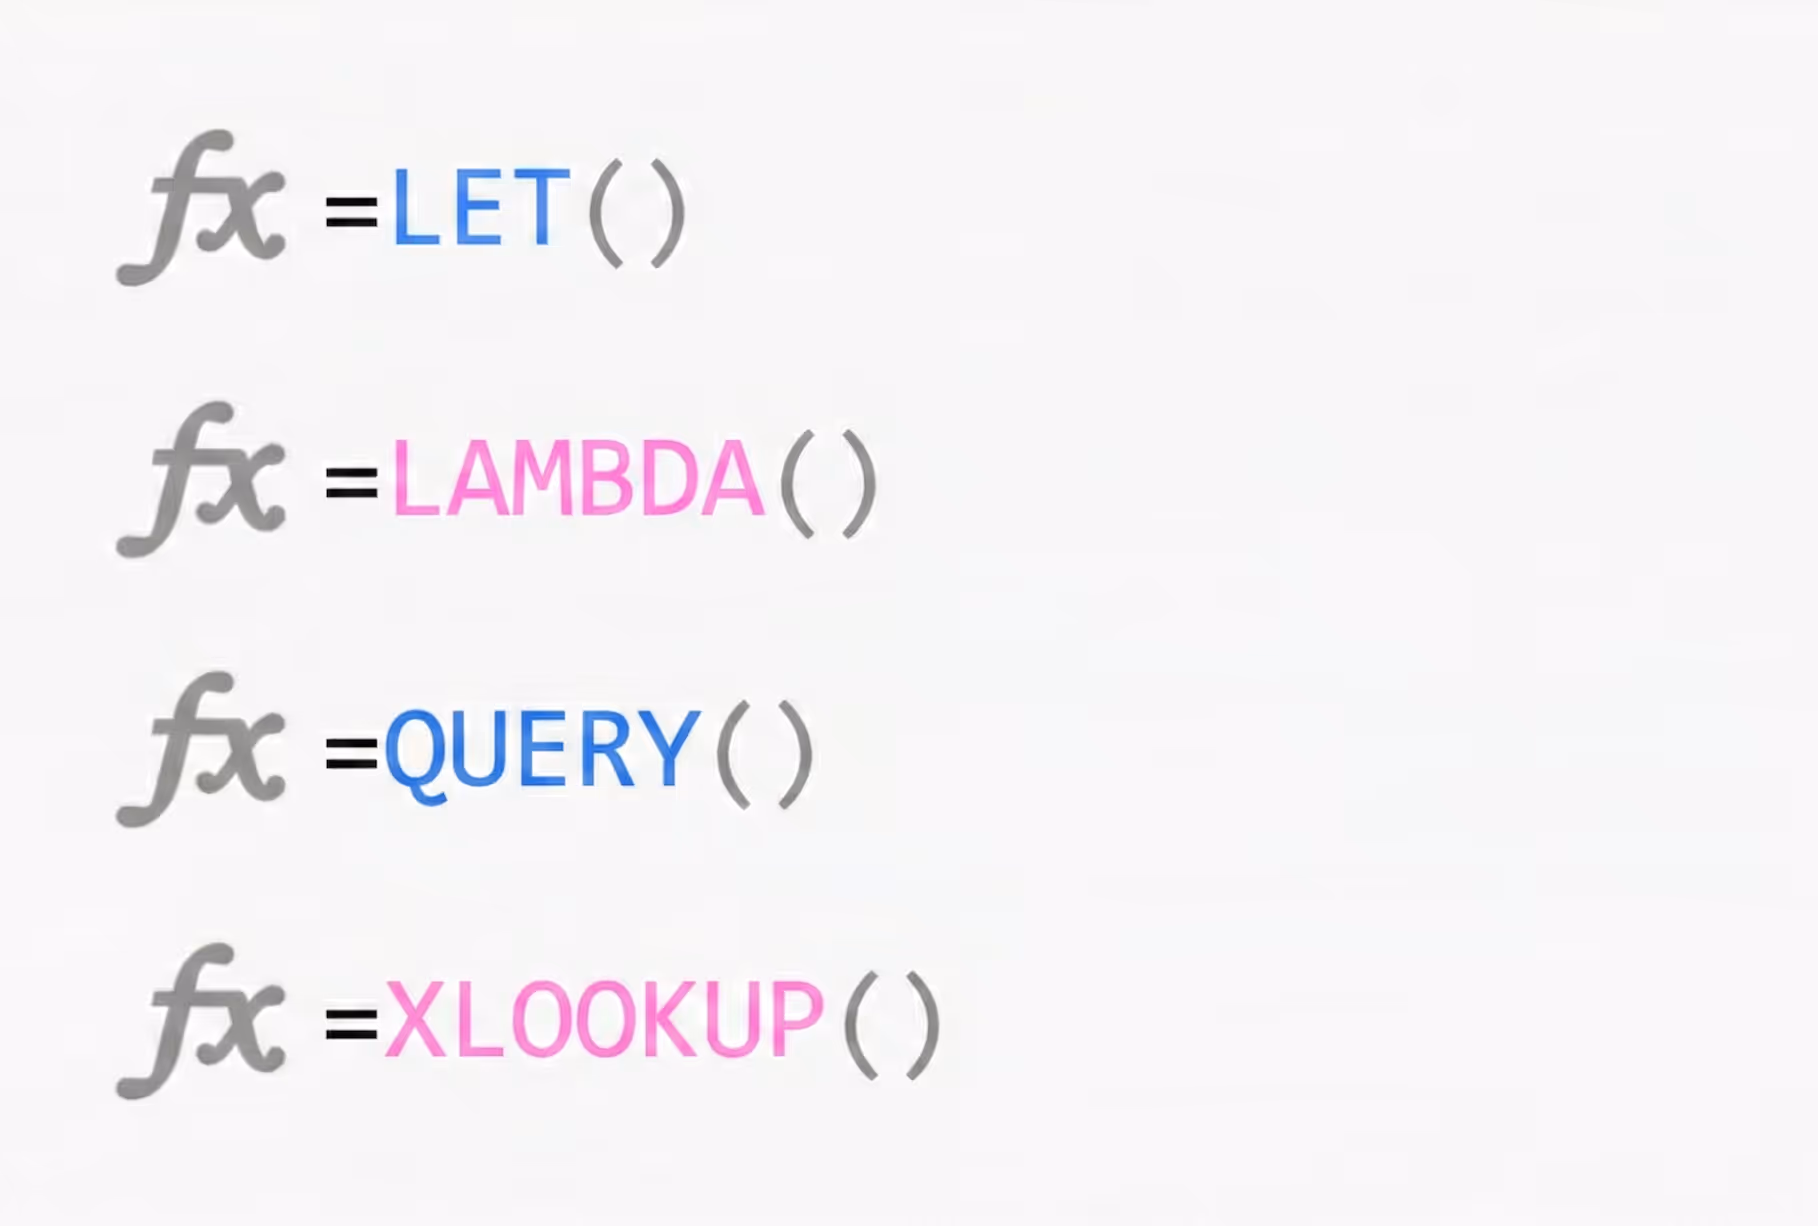
These make dynamic dashboards easier to maintain, especially alongside ARRAYFORMULA, infinite ranges, and rolling windows.
5. AI-Assisted Reporting and Forecasting
Today, after structuring your data:
- You can ask AI (including Google’s built-in Duet AI) to summarize trends
- generate forecast models
- identify anomalies
- build visualizations
This complements the spreadsheet automations described in the original article.
6. Data Lakes and Warehouses Are Becoming Standard
For companies managing very large datasets:
- Google BigQuery
- Snowflake
- Databricks
are now part of the reporting stack.
Sheets often acts as the front-end interface for interaction, while Import.io feeds the warehouse with fresh web data.
2025 Takeaway
The original practices in this article are clean structure, consistent formatting, automated transfers, infinite formulas, and rolling windows, they remain foundational.
What’s new in 2025 is the emphasis on:
- Continuous pipelines instead of manual exports
- AI-powered transformation and insights
- Governance and traceability for compliance
- Modern spreadsheet functions for scalability
Together, these upgrades allow teams to build reporting workflows that are faster, cleaner, more automated, and ready for AI-driven analytics.
